Service · Security, Visibility & Analytics

Network & Data Analytics - Visibility, Intelligence, and Operational Insight

PalC designs and deploys analytics solutions that turn network and operational data into actionable insights - gNMI streaming telemetry, sFlow/NetFlow/IPFIX flow analytics, time-series and flow data pipelines, anomaly detection, capacity planning, and operational dashboards for carrier, enterprise, and data centre networks.

Network & Data Analytics Stack - PalC Coverage
Collection & TelemetrygNMI · sFlow · NetFlow · IPFIX · SNMP · Syslog · OpenConfig
Ingestion & Stream ProcessingApache Kafka · Flink · Logstash · Vector · Telegraf
EnrichmentGeoIP · ASN · CMDB
Storage - Time-Series & FlowInfluxDB · VictoriaMetrics · Elasticsearch · ClickHouse · S3
TSDBPrometheus · Thanos
Analytics, ML & Anomaly DetectionPython · Spark · Isolation Forest · ARIMA · Prophet
Visualisation & AlertingGrafana · Kibana · Alertmanager · PagerDuty
StreamReal-time Telemetry
FlowLevel Visibility
MLAnomaly Detection
gNMINetFlowKafkaGrafanaClickHouse
StreamReal-time Telemetry
FlowLevel Visibility
MLAnomaly Detection

Network data is abundant but rarely actionable by default. Telemetry sits in silos, flows are sampled but never queried, and dashboards show metrics without the context needed to diagnose or predict. PalC designs and deploys analytics solutions that address the full chain - defining what to collect and at what fidelity, building the ingestion and storage pipelines that scale, and engineering the dashboards, alerts, and anomaly detection models that turn raw data into decisions. This work is shaped by real experience with carrier-scale flow analysis, gNMI streaming telemetry from SONiC and open networking platforms, and network security analytics for enterprise and regulated environments.

Core Capabilities

Depth across telemetry collection, data pipelines, analytics, and operations

PalC covers the full analytics stack - from telemetry collection strategy and pipeline engineering through time-series storage, flow analytics, ML-based anomaly detection, and operational dashboards.

01

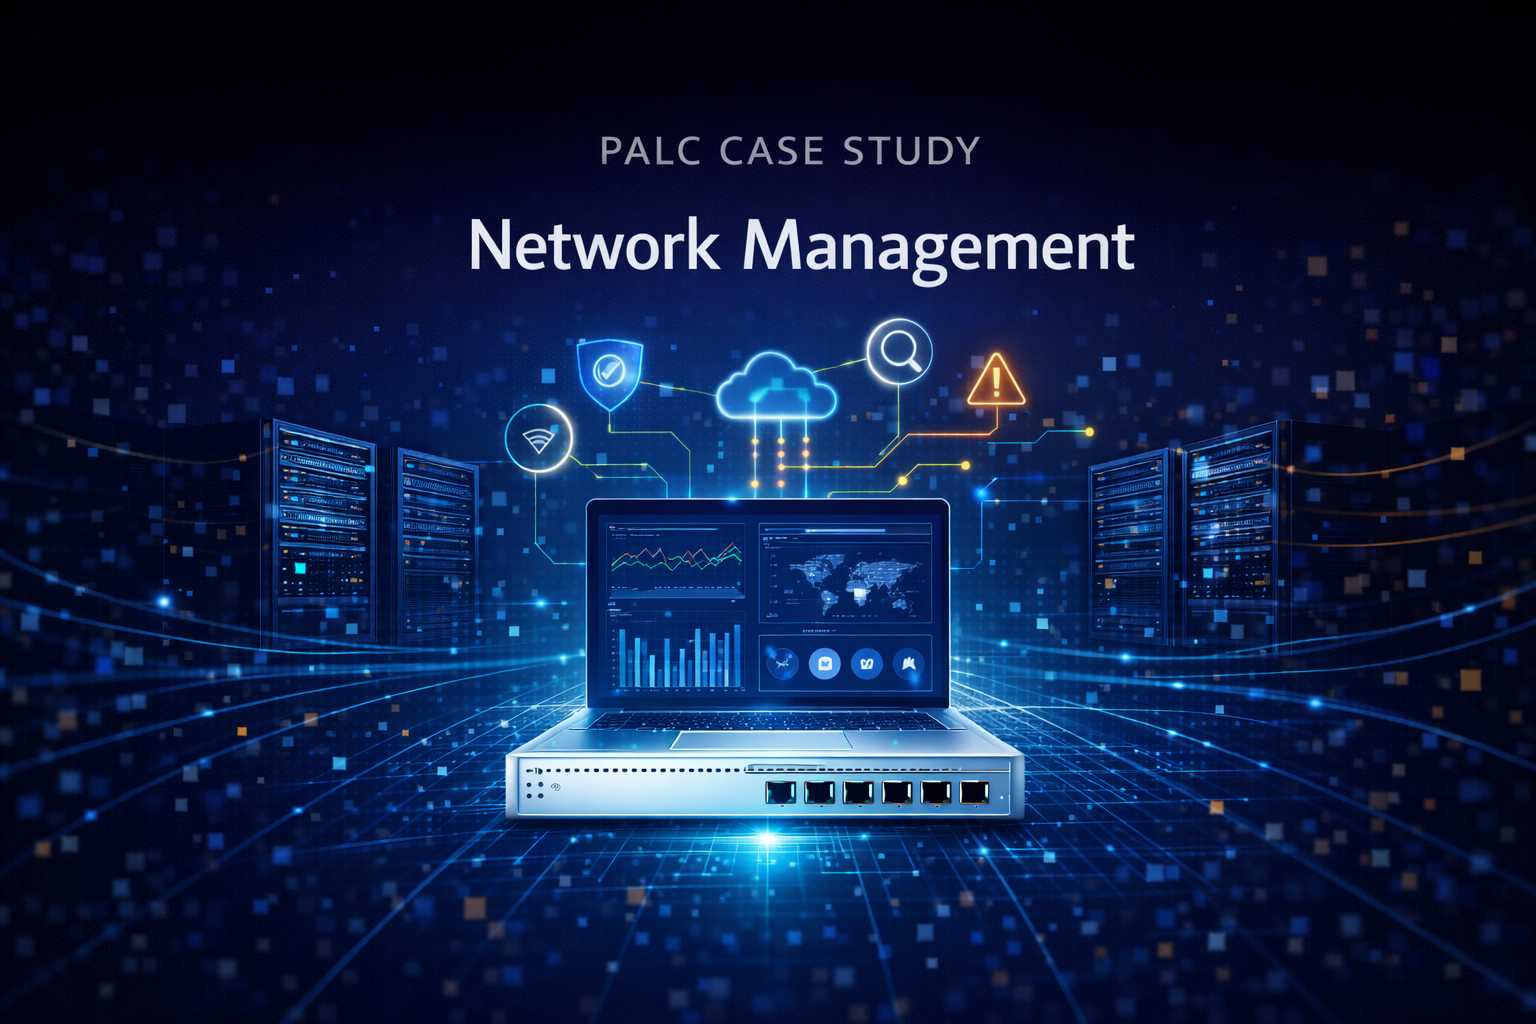
Telemetry & Streaming Observability

Design and deployment of network telemetry collection pipelines covering all data types - gNMI streaming from open networking devices, sFlow/NetFlow/IPFIX flow records, SNMP polls, and structured syslog - aligned to operational and security analytics requirements.

  • gNMI streaming telemetry from SONiC, OcNOS, and OpenConfig-capable devices
  • sFlow, NetFlow v5/v9, and IPFIX flow collector design and deployment
  • SNMP polling integration - interface counters, BGP state, optical power
  • Structured syslog collection and parsing - rsyslog, Fluentd, Vector
  • OpenConfig model-based telemetry subscription management
02

Data Pipeline & Stream Processing

Building high-throughput ingestion and processing pipelines that handle network telemetry at scale - stream processing for real-time enrichment, filtering, and aggregation before data reaches storage or analytics layers.

  • Apache Kafka for high-throughput telemetry and flow ingestion pipelines
  • Apache Flink and Spark Structured Streaming for real-time flow processing
  • Telegraf, Vector, and Logstash for telemetry collection and routing
  • Flow record enrichment - GeoIP, ASN lookup, CMDB context, BGP community
  • Aggregation and sampling strategies for high-volume flow environments
03

Time-Series & Flow Data Storage

Selection and deployment of appropriate storage backends for network metrics and flow data - time-series databases for metrics, columnar stores for high-cardinality flow analytics, and tiered archival for long-term capacity and trend analysis.

  • Time-series storage - InfluxDB, VictoriaMetrics, Prometheus + Thanos
  • Flow and event analytics - ClickHouse, Elasticsearch, OpenSearch
  • Long-term archival - S3-compatible object storage with retention policies
  • High-cardinality metric strategies - label cardinality management
  • Data lifecycle management - tiering, compaction, and expiry automation
04

Analytics, ML & Anomaly Detection

Statistical and machine learning-based analysis of network telemetry and flow data - anomaly detection for traffic shifts and security events, forecasting for capacity planning, and top-N analysis for traffic engineering decisions.

  • Traffic anomaly detection - Isolation Forest, z-score, and ARIMA-based models
  • Capacity forecasting - Prophet and linear trend models for growth planning
  • Top-N flow analysis - top talkers, top destinations, protocol distribution
  • BGP route analytics - prefix churn detection and path change correlation
  • Security analytics - DDoS detection, port scan identification, beaconing detection
05

Dashboards & Operational Visualisation

Network operations dashboards built for the engineers who use them daily - interface health, BGP session state, flow top-N, optical power, and SLA tracking visualised in Grafana with alert routing to on-call workflows.

  • Grafana dashboard engineering - network topology, interface, and flow panels
  • Kibana and OpenSearch Dashboards for log and flow analytics exploration
  • SLA and SLO tracking dashboards - error budget, latency, and availability
  • Alertmanager and PagerDuty integration - severity-routed alerting
  • Custom Grafana plugins and panel development for network-specific visualisations
06

Security Analytics & SIEM Integration

Network flow and telemetry data fed into security analytics workflows - DDoS detection, threat hunting, lateral movement identification, and SIEM integration bringing network visibility into the security operations picture alongside host and application events.

  • NetFlow/IPFIX-based DDoS detection - volumetric and protocol-specific signatures
  • Threat hunting workflows - top-N destinations, unusual protocol distributions
  • SIEM integration - Elastic SIEM, Splunk, and Wazuh with flow data enrichment
  • Network anomaly correlation - flow events correlated with host and auth events
  • Automated response - flow-triggered alerting and quarantine workflow hooks

Technical Deep Dive

Proven engineering across gNMI telemetry, flow pipelines, and analytics

PalC engineers work at the data and platform level - gNMI subscriptions from SONiC, Kafka-based flow pipelines, ClickHouse for high-cardinality flow analytics, and Grafana dashboards built for network operations teams.

Telemetry - gNMI streaming from SONiC / OpenConfig

Streaming interface and BGP state from open networking devices

gNMI SUBSCRIBE streams interface counters, optical power, and BGP session state in real time - replacing slow SNMP polls with sub-second telemetry delivered directly into Prometheus or InfluxDB.

# gNMIc - gNMI subscription from SONiC device
gnmic --address spine-01:57400 --username admin --password '***' subscribe --path '/interfaces/interface/state/counters' --path '/network-instances/network-instance/protocols/protocol/bgp/neighbors/neighbor/state' --mode stream --stream-mode sample --sample-interval 10s --format prometheus --port 9273
ProtocolgNMI / gRPCModelOpenConfig YANGOutputPrometheus / TSDBIntervalSub-10s streaming

Pipeline - Kafka + GoFlow2 NetFlow / sFlow ingestion

High-throughput flow record ingestion into Kafka topics

GoFlow2 decodes NetFlow v9/IPFIX and sFlow records from routers and produces enriched JSON to Kafka - downstream consumers write to ClickHouse for analytics and Elasticsearch for security investigation.

# GoFlow2 - NetFlow collector to Kafka producer
transport.kafka.brokers kafka:9092
transport.kafka.topic network.flow
format json
listen "netflow://:2055"
listen "sflow://:6343"
workers 4
# 50k flows/sec sustained throughput
CollectorGoFlow2BusApache KafkaFlow/s50k+ sustainedSinkClickHouse / ES

Analytics - ClickHouse flow analysis queries

Sub-second top-N and anomaly queries over billions of flows

ClickHouse column storage enables sub-second aggregate queries over billions of flow records - top-N source ASNs, protocol distribution, sudden traffic volume spikes, and DDoS candidate detection.

-- ClickHouse top source ASNs last 5 min
SELECT as_src, sum(bytes) AS total_bytes, count() AS flow_count
FROM network_flow
WHERE timestamp > now() - INTERVAL 5 MINUTE
GROUP BY as_src
ORDER BY total_bytes DESC
LIMIT 20;
StorageClickHouse columnarQuerySub-second aggregatesScaleBillions of rowsUse casesTop-N · DDoS · ASN

Dashboards & Alerting - Prometheus + Alertmanager

Interface utilisation alerting with severity-routed notifications

Prometheus recording rules pre-compute utilisation ratios - Alertmanager routes interface saturation alerts to Slack for low severity and PagerDuty for critical, with inhibition rules suppressing child alerts during parent outages.

# Prometheus - interface utilisation recording rule
- record: interface_utilisation_ratio
  expr: rate(ifHCOutOctets[5m]) * 8 / ifHighSpeed * 1e6
# Alertmanager route maps warning -> Slack, critical -> PagerDuty
MetricsPrometheus TSDBDashboardsGrafanaRoutingAlertmanagerOn-callPagerDuty / Slack

Technology Stack

Telemetry, analytics, and observability tooling

PalC's network and data analytics practice covers the full stack - from telemetry collection and stream processing through time-series and flow storage, ML analytics, dashboards, and SIEM integration.

Network & Data Analytics Stack - PalC Engineering Coverage
Telemetry CollectiongNMI · sFlow · NetFlow v5/v9 · IPFIX · SNMP · Syslog · OpenConfig
Ingestion & Stream ProcessingApache Kafka · Flink · Telegraf · Vector · Logstash · GoFlow2
EnrichmentGeoIP · ASN · CMDB
Time-Series & Flow StoragePrometheus · VictoriaMetrics · InfluxDB · ClickHouse · Elasticsearch
ArchiveS3 · Thanos
Analytics & MLPython · Apache Spark · Isolation Forest · ARIMA · Prophet · DDoS detection
Visualisation & AlertingGrafana · Kibana · Alertmanager · PagerDuty · Slack
ReportingJupyter · PDF reports
Security Analytics & SIEM IntegrationElastic SIEM · Splunk · Wazuh · Flow-based threat hunting

Collection & Protocols

  • StreaminggNMI · OpenConfig
  • FlowsFlow · NetFlow · IPFIX
  • Poll-basedSNMP v2c / v3
  • LogsSyslog rsyslog
  • CollectorTelegraf GoFlow2

Pipeline & Storage

  • Message BusApache Kafka
  • Stream Proc.Flink · Spark Streaming
  • TSDBPrometheus · VictoriaMetrics
  • Flow DBClickHouse Elastic
  • ArchiveS3 Thanos

Analytics & Visualisation

  • DashboardsGrafana · Kibana
  • ML ModelsPython · Spark MLlib
  • ForecastingProphet · ARIMA
  • AlertingAlertmanager
  • SIEMElastic Splunk Wazuh

Our Approach

A structured approach to network and data analytics

From data strategy and requirements through pipeline engineering, analytics development, and ongoing operations and evolution.

Phase 01

Data Strategy & Requirements

Defining what to collect, at what fidelity and frequency, how long to retain it, and which operational and security use cases each data type will serve

Phase 02

Platform & Pipeline Engineering

Building telemetry collection, Kafka-based ingestion pipelines, time-series and flow storage, and enrichment infrastructure that scales with network growth

Phase 03

Insights & Automation

Dashboards, alert rules, anomaly detection models, and reporting automation that deliver actionable intelligence to network operations and security teams

Phase 04

Operations & Evolution

Ongoing pipeline tuning, storage capacity management, model retraining, new data source onboarding, and evolution of dashboards as the network and business change

Analytics StackgNMI · OpenConfigNetFlow · IPFIX · sFlowApache KafkaClickHousePrometheus · GrafanaIsolation Forest · ProphetElastic SIEM · SplunkAlertmanager · PagerDuty

Deployment Scenarios

Where this is applied

Proven analytics patterns for carrier network operations, enterprise visibility, data centre telemetry, security analytics, and capacity planning across diverse network environments.

Carrier & Service Provider Network Operations

Large-scale NetFlow/IPFIX analytics for carrier traffic engineering - top-N subscriber analysis, peering traffic visibility, BGP path change correlation, and SLA monitoring across multi-hundred-node IP and MPLS networks.

Data Centre & Open Networking Telemetry

gNMI streaming telemetry from SONiC and OcNOS-based leaf-spine fabrics - interface utilisation, ECMP flow balance, BGP session state, and optical power monitoring with sub-second refresh rates and Grafana NOC dashboards.

Network Security Analytics

Flow-based DDoS detection, port scan identification, and lateral movement detection - NetFlow and IPFIX records processed through Kafka into ClickHouse for fast anomaly queries and Elastic SIEM for correlation with host security events.

Capacity Planning & Traffic Forecasting

Time-series forecasting for network capacity decisions - Prophet and ARIMA trend models applied to interface utilisation and flow volume history, with quarterly capacity reports and growth scenario modelling for infrastructure investment planning.

Enterprise WAN & Branch Visibility

End-to-end visibility across enterprise WAN and SD-WAN environments - application traffic classification, circuit utilisation trending, SLA latency and jitter monitoring, and top-application dashboards for IT operations teams.

Cloud & Hybrid Network Observability

Unified observability across on-premises and cloud networking - VPC flow logs, cloud-native metrics, and on-premises NetFlow aggregated into a single Grafana view for hybrid infrastructure teams managing mixed environments.

Business Outcomes

What organisations achieve with PalC network and data analytics

Actionable insights from network and operational data

Performance, security, and capacity visibility transformed into decisions - interface saturation alerts before users notice, DDoS onset detected in seconds, and capacity headroom quantified in Grafana dashboards that operators actually trust.

Faster troubleshooting and root-cause analysis

Telemetry and analytics for incident response - flow data and gNMI interface counters available at the exact time of the incident, not just averages, enabling root cause identification in minutes rather than hours of log archaeology.

Data-driven capacity and investment planning

Trend analysis and forecasting that answers capacity questions with evidence - which circuits will saturate in the next quarter, which peering links need upgrading, and where traffic growth is concentrated enough to justify infrastructure investment.

Improved security posture through flow visibility

Anomaly detection and threat visibility from network flows - DDoS candidates flagged in under 60 seconds, unusual outbound traffic patterns surfaced for investigation, and flow data enriching SIEM alerts with network-layer context.

Reduced operational blind spots across the network

Unified view across flows, metrics, and logs - interface counters from gNMI, flow summaries from ClickHouse, and device events from syslog all visible in a single Grafana workspace, closing the gaps that exist between disconnected monitoring tools.

Operational self-sufficiency for NOC and engineering teams

Analytics platforms and dashboards that teams can extend themselves - Grafana dashboards documented and version-controlled, alert rules reviewed and tuned during the engagement, and runbooks for common failure scenarios delivered at handover.

Platform Operations

Analytics pipelines that are monitored, maintained, and continuously growing

PalC builds operational tooling around every analytics platform - pipeline health dashboards, storage capacity monitoring, data lag alerting, and structured handover documentation so engineering teams can onboard new data sources and evolve dashboards as the network changes.

  • Pipeline health and data lag monitoring - Kafka consumer group lag tracked in Grafana - alert when flow ingestion falls behind the collector, Telegraf scrape failure rates monitored, and gNMI subscription reconnect events logged and alerted to prevent silent telemetry gaps.
  • Storage capacity and retention management - ClickHouse partition growth and Prometheus TSDB cardinality tracked continuously - automated tiering to S3-compatible object storage before local disk pressure, and retention policies reviewed and tuned as data volumes grow.
  • Alert tuning and noise reduction - Network alerting reviewed after initial deployment - flapping interface alerts rate-limited, BGP session flap alerts correlated with maintenance windows, and high-volume low-fidelity signals suppressed without masking genuine events.
  • New data source onboarding and dashboard evolution - Structured process for adding new telemetry sources - collector configuration, schema design for ClickHouse or TSDB, Grafana panel development, and alert rule engineering delivered consistently as the network infrastructure expands.
Alerting & On-callAlertmanager · PagerDuty · Slack
Dashboards & ExplorationGrafana · Kibana · Jupyter notebooks
Analytics & MLClickHouse · Spark · Prometheus · TSDB
Pipeline & ProcessingKafka · Flink · Vector · Telegraf
Network Telemetry LayergNMI · sFlow · NetFlow · SNMP · Syslog
Lag-MonitoredCapacity-TrackedSelf-Extending

Ready to unlock insights from your network data?

Whether deploying gNMI streaming telemetry from open networking devices, building a flow analytics platform for carrier-scale visibility, adding ML-based anomaly detection, or integrating network flows into security operations - PalC engineers can deliver the right analytics architecture.

Get in touch

Discuss your infrastructure goals with our experts.

Contact Team

Security, Visibility & Analytics

Other services in Security, Visibility & Analytics

Security, Visibility & Analytics

Security Engineering

CIS hardening, Cilium network policy, Falco runtime detection, SAST/DAST pipelines, SIEM integration, and incident response - security embedded in infrastructure from architecture through operations.

Explore service

Security, Visibility & Analytics

Identity & Access Management

Zero trust architecture, passwordless MFA, JIT privileged access, identity governance, and OPA-based authorisation - identity as the security perimeter for enterprise and regulated environments.

Explore service

Solutions

Networking Visibility & Monitoring Solution

The full PalC network visibility solution - streaming telemetry, flow analysis, anomaly detection, and operational dashboards for carrier, enterprise, and open networking infrastructure.

Explore solution

Proven outcomes from the field

Deployments across AI fabrics, multi-cloud, automation, and security.

ODM PARTNERS

TRUSTED BY LEADING TECHNOLOGY PARTNERS